


On this dialog you can bootstrap the mean and the supremum Nyblom test. Since the asymptotic distributions are only available for the models with a restricted and with an unrestricted constant, it is currently not possible to compute an empirical distribution based on "Bartlett correction" through the mean of the empirical relative to the mean of the asymptotic for the models with a restricted and with an unrestricted linear trend. Once the asymptotic distributions for these trend-type models have been simulated, then SVAR will also allows for plotting of the asymptotic distribution for these additional models as well as test distributions that have been Bartlett corrected using the mean of the empirical. Furthermore, at that stage it will also be possible to plot p-value, PP and QQ plots when the VAR model includes a restricted or an unrestricted linear trend term.
|
Figure: The bootstrap Nyblom supremum and mean tests distributions dialog. |
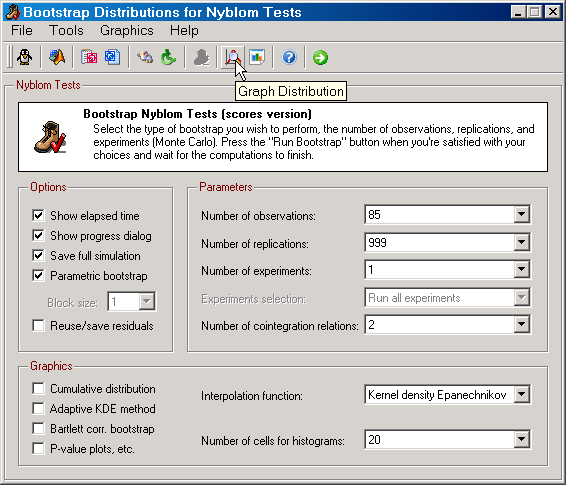
Notice that the asymptotic distributions are only be available when there are no exogenous stochastic variables and no deterministic variables other than those created by SVAR. Moreover, asymptotic distributions for restricted β estimates will not be available as these have not been derived theoretically.
Power
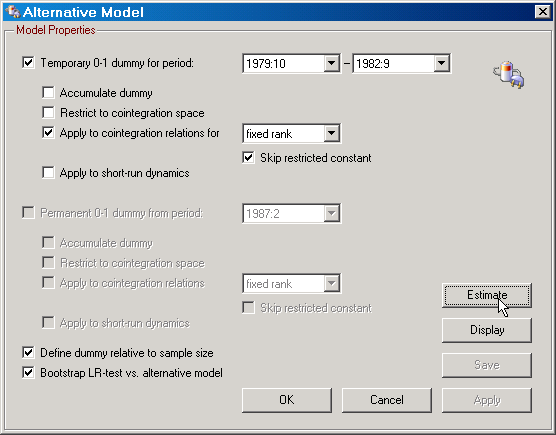
The dialog for bootstrapping the Nyblom tests for the constancy of β, includes the features of selecting and using an alternative model to generate the data for the bootstraps. The alternative model is based on setting up a dummy variable and determining its properties. The dummy variable can either be regarded as "temporary" or "permanent", it can be treated as a deterministic variable by itself or applied to the cointegration relations. The latter case means that either the cointegration space will vary over time with the dummy for a fixed rank, or that the rank of the space varies over time. In the latter case, the rank either increases or decreases by 1 during the period when the dummy is active. Moreover, only the vector of α and β affecting the rank change are allowed to vary with the dummy, thus limiting the number of parameters that can change over time. When the dummy is regarded as an extra deterministic variable it can be restricted to the cointegration space and it can also be accumulated. These are options that need to be selected by the user.
The construction of the dummy variable and the selection of options is performed on the "Alternative Model" dialog which can be opened from the toolbar or Tools menu of the "Bootstrap Distributions for Nyblom Tests" dialog. The selection of whether to use the original model or the alternative model for generating the pseudo-data is handled from the toolbar or the Tools menu as well.
|
Figure: Selection of an alternative model for the Nyblom mean and supremum tests. |
Monte Carlo
SVAR can evaluate the bootstraps of the Nyblom tests using Monte Carlo methods. To compute Monte Carlo bootstraps the user must set the "Number of experiments" drop down control to something different from 1. With only 1 experiment, SVAR computes the ordinary bootstrap. When Monte Carlo bootstrapping has been selected it means that bootstrapping will be performed in two steps.
| 1. | Given the selected data generating process (either the original model or the alternative), SVAR generates pseudo-data for the selected model and estimates the original model and computes the Nyblom tests. |
| 2. | Given the estimated parameters from step 1, it generates pseudo-data for the original model, estimates that model based on the new pseudo-data and computes the Nyblom tests. |
Step 2 is repeated B times in each experiment under Monte Carlo bootstrapping, the tests are sorted and the rejection rate is calculated for the tests computed in step 1. The parameter B is here equal to the number of replications. The number of experiments determines how many times these two steps are repeated. Monte Carlo rejection rates are then calculated on the basis of the rejection rates for each experiment. For example, if 100 experiments are computed and the rejection rate is less than a nominal size of 5 percent in 10 of the experiments for, e.g., the Nyblom mean statistic, then the Monte Carlo rejection rate is 10 percent for a nominal size of 5 percent. The Monte Carlo procedure similarly evaluates the asymptotic tests when asymptotic distributions are available, but then step 2 above is not considered since the asymptotic distribution is used instead of the bootstrap distribution.
The Monte Carlo evaluation also makes it possible to compute means, standard deviations and confidence bands for bootstrap quantiles, as well as of rejection rates for the tests based on the original data.
Since running a large number of experiments may require a lot of computer time, SVAR allows you to run 10 or 20 percent of the experiments at a time. For example, on my Windows 2K P4 mobile machine with 512MB of RAM it takes roughly 2 days to run 1000 experiments, using 999 replications for a data set with 204 effective observations when the Nyblom mean and supremum tests are computed using the score version and all parameters are updated in the recursion; see Bruggeman, Donati and Warne (2003) and Hansen and Johansen (1999) for details. When 100 experiments are run in one go, the execution time is about 5 hours.