


The main program window contains all the so called controls for formulating and estimating a VAR model with or without exogenous stochastic and deterministic variables.
Apart from 5 menus (File, Edit, Tools, Graphics, and Help) and a toolbar, the main program window contains a model description area (which presents the analytical form of your model), 3 tabs containing various model specification controls (Data, Parameters, and Output), and a taskbar at the very bottom.
The most important functions on the Main Program window are:
| • | Let you specify personal Preferences on SVAR's general behavior and save these on the hard drive (in the file var.ini). This is achieved by clicking on the Preferences icon on the toolbar or selecting Preferences from the Tools menu (Alt+T+P or Ctrl+F). |
| • | Import data, specify the sample dates, and variable names from the Data tab (see Data Input). This is done on the Data tab. |
| • | Specify the output file on the Output tab. |
| • | Specify whether you want to estimate a model in reduced form or in structural form on the Parameters tab. |
| • | Specify names for structural shocks on the Parameters tab. |
| • | View graphs of your data in levels and first differences (see Editing Graphics). |
| • | Set a few parameters such as lag orders for endogenous and exogenous variables, number of responses, and confidence band size on the Parameters tab. |
| • | Specify whether cointegration analysis should be performed or not on the Parameters tab. |
| • | Specify deterministic terms in the model (constant, linear trend, seasonal dummies) on the Parameters tab. |
| • | Determine which groups of specification tests should be performed on the Parameters tab. |
| • | Save your settings in VAR Model Files (see The Model File). This is achieved by, e.g., clicking on the Save icon on the toolbar. |
| • | Manage your VAR Model Files. This is possible from by selecting Reopen Model on the File menu and then choosing Reorder List from the (Alt+F+R+R or Ctrl+R). |
| • | Start estimation of your model. If you've opted for cointegration analysis the first stop along this trail is the Cointegration Rank Tests dialog when using SVAR for classical analysis; See the Estimation tab on the Preferences dialog for selecting classical or Bayesian analysis. |
| • | View a LaTeX, PostScript or PDF Preview of the output file (see TeX). |
| • | View or Print the output file; and |
| • | Exit the program. |
|
Figure: The main program window in SVAR displaying the Parameters tab. |
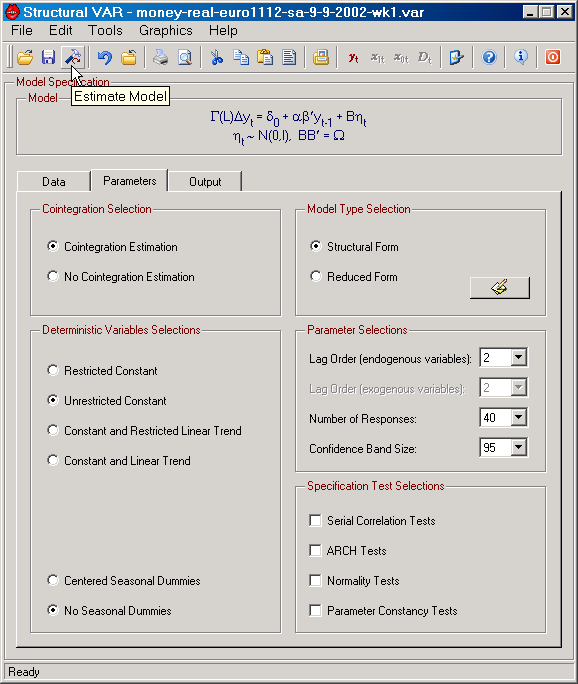
It should be noted that the number of responses controls both the number of impulse responses, generalized and "structural" (orthogonalized), and the maximum forecast horizon. Similarly, the confidence band size (e.g 95) controls the width of confidence bands for impulse responses, recursive parameter estimates, as well as the nominal size for recursive tests in graphs. Typically, all tests can provide you with a p-value, but in graphs p-values are not always useful!
In addition, SVAR allows you to:
| • | View a general representation of the model in the Model frame. |
| • | Run a model selection help function where information criteria a computed for various lag lengths and cointegration ranks. This function is found on the Tools menu (Alt+T+M). |
| • | View previously saved graphs of data (Alt+G+O or Ctrl+G). |
| • | Create new graphs (Alt+G+N or Ctrl+W). |
| • | Change the scale all variables (Alt+T+C); and |
| • | Provides you with a simple way to learn more about the program; like reading the license file... |
Since there are certainly one or two features missing from these function, you may want to check the To Do list before getting too upset!